

May 20, 2025
Regional Fossil-Only Carbon Intensity
There's a new endpoint in the Grid Carbon API: generated fossil-only carbon intensity, which represents the combined carbon intensity of all fossil-fuel generators in a region. The endpoint accepts a list of up to 10 regions, so you can also request the fossil-only intensity of a multi-region area.
This fossil-only data can be used as a conservative estimate for the "residual mix emission rate", or the emission rate of power that has not already been claimed through REC purchases or PPAs. See our documentation for a more detailed explanation.
MISO Consumed Emissions
MISO's Consumed Emissions dashboard leveraging CarbonFlow™ is live! We've released a new webpage and API allowing users to explore real-time and historical consumed emissions data at groundbreaking spatial granularity - down to the county level. Read more about our efforts to provide data that is orders of magnitude more detailed than the current industry standard in this new Canary Media article: https://www.canarymedia.com/articles/emissions-reduction/miso-carbon-tracking-data-singularity.
Here's one quote from Singularity's research and policy lead Greg Miller: “Publicly accessible data at the hourly and county level is breaking new ground in the world of grid carbon accounting. This may be for only one region in the U.S. But it proves it’s possible to calculate this data — and other grid operators can do it too, if this data were required more broadly in accounting standards."
Open Grid Emissions
We have released OGE versions v0.5.0 and v0.6.0. The improvements include expanded historical coverage back to 2005, new 2023 data, aggregation at the subplant level, and other methodological and usability improvements. See the full release notes here.
July 3, 2024
Grid Carbon API
We have rebranded our data product to "Grid Carbon API". Aside from a face lift, this update now allows new (trial) users unrestricted access to our historical data for 60 days. Sign up for an account here.
Webhooks
We have made reliability and stability improvements to our webhooks. If you are one of the few customers who have not yet migrated to using our webhooks feature, please reach out to us to get set up!
Marginal data improvements
In both the PJM and SPP regions, our marginal data accuracy has been improved. We now make sure to offer the latest marginal data that is available in both of those regions.
Open Grid Emissions
Over the last quarter, we have released OGE version v0.4.0. The improvements include better validation checks as well as using the IPCC Assessment Report to calculate CO2-equivalent values. See the full release notes here.
March 20, 2024
Webhooks
As promised, we now have webhook support live in production. Instead of tuning your API request frequency to minimize latency, just pick the regions and event types you're interested in, sit back, and let us send you the data the instant it's available. You'll also receive any recent events that were updated after initial release, so you can be confident that you always have the latest and most accurate data.
If this sounds interesting, let us know and we'll get you set up.
New API Endpoints
Two new endpoints in our V2 API: you can now use latitude/longitude coordinates or a ZIP code to look up the correct region code.
Forecast Improvements
We're continually tuning our forecast models to improve predictions, and expanding coverage to more regions. You can now request our new and improved fuel mix and carbon intensity forecasts for all the real-time ISOs (BPA, CAISO, ERCOT, ISONE, MISO, NYISO, PJM, SPP) as well as select other regions (AZPS, PSCO, TEPC, TVA, WACM). If you'd like to see forecasts for a region not listed here, reach out!
Open Grid Emissions
We've released OGE updates several times in the last few months, with the latest version at v0.3.3. Improvements include 2022 data, more data validation, and a number of code infrastructure and documentation updates. See the release notes here: https://github.com/singularity-energy/open-grid-emissions/releases.
September 25, 2023
Québec Data Coverage
Thanks to Hydro Québec's (HQT) recent work to publish their data, we have been able to integrate the HQT region into our data offering. Their data is available by specifying the region as "HQT" when querying our API. Their data is available in realtime and goes back to January 1st, 2019.
Hourly Data Resolution
Most of our API V2 endpoints now accept a new query parameter: "resolution". This allows users to query windows of data with a higher level of data granularity. By default, we previously only offered 5-minute intervals as the data resolution. If you wanted to have hourly summaries of the data, you would have had to do that yourself. Now you can specify "1h" or "5m" to signify that you would like a 1-hour or 5-minute resolution of data. If you do not include the new parameter, the default will be "5m" for all endpoints that accept the "resolution" parameter.
Coming soon: Webhooks
What data is available? When is new data available? When should I query to get the latest data for a region?
Gone are the days of needing to set up complex client-side querying on your end. Instead, we offer a way to subscribe to new data, and receive it as soon as it's available. You can specify which region, event type and URL to send the data to and our infrastructure will handle delivery to your system. This feature will be enabled for paying customers only.
If you'd like to beta test this new feature, please let us know! We'd be happy to set you up.
July 20, 2023
EIA Forecasts
We've got some freshly baked forecasts, ready to serve! In addition to the existing five minute and hourly forecasts available for our real-time ISO regions, we now have hourly fuel mix and carbon intensity forecasts available for EIA regions, always reaching at least 24 hours into the future. At the moment this is only enabled for select regions (PSCO, WACM, and ERCO), but we'll be gradually rolling it out to cover more of the US. If you're interested in forecasting a particular region that we haven't covered yet, feel free to reach out to info@singularity.energy.
Consumed Fuel Mix
New in the V2 API, you can now see the consumed fuel mix of any EIA region, which accounts for imports and exports. You can find more information about what this is and why it's important on our blog.
Compliance API
Our Compliance solution has some new and improved documentation, in addition to new BERDO coverage for buildings in the city of Boston. We'll continue to expand our coverage to more cities and states in the US in the coming months.
Other improvements and fixes
- All regions now return consistent fuel mix categories. Previously, some regions could omit fuels when they didn't produce any power.
- Data availability endpoint now shows expected latency for some regions and event types
March 29, 2023
Security Assessments
As part of our security routine, we regularly engage with third party security firms to perform automated and manual assessments of our APIs and applications. The most recent assessments were completed this month, and found no issues of concern in any of our services.
As noted in previous changelog editions, we've also undergone a full SOC 2 audit resulting in many improvements and a clean bill of health, and that report will be available within the next month.
Please email info@singularity.energy if you'd like copies of these reports or have any other security questions.
Other improvements and fixes
- OGE v0.2.1, fixing some inaccurate emissions and generation totals caused by mismatched data between EIA-860 and EIA-923
- OGE v0.2.2, fixing a bug that impacted CO2 emissions for some parts of the Southeastern US
January 9, 2023
ERCOT
Until now, ERCOT has been the lone major US ISO to not offer real-time fuel mix data. In its absence, we had to make do with their month-behind historical data and EIA's day-behind data. But despair no more, for real-time ERCOT is finally a reality! Try out the ERCOT region code in the /latest and /search endpoints of our API to see what's happening at this moment in Texas.
Historical data has been moved to the ERCOT-H region - use that code to search for data from last year and earlier. Note that historical and real-time data have somewhat different fuel categories for the moment. In the coming months we'll analyze the relationship between the real-time and historical data sources and attempt to unify them.
OGE 2021
Waiting for 2021 Scope 2 emissions factors to complete your annual GHG inventory? Hourly, monthly, and annual-average 2021 factors for all U.S. grid regions are now available to download through the Open Grid Emissions Initiative!
See the full release notes of OGE v0.2.0 for the substantial list of improvements in addition to 2021 data.
The Open Grid Emissions Initiative is based on the same underlying methodology and data sources as the U.S. EPA’s eGRID annual emissions factors, but integrates key innovations from peer-reviewed research to improve the coverage and granularity of the data.
The OGE dataset also includes hourly emissions data for every individual plant in the U.S., as well as other power system operational data, which is useful for analysts, researchers, and policymakers.
We're hiring!
If you know anyone who is passionate about decarbonization, has a few years of software engineering experience, and wants to learn more, check out the job description and please reach out!
Other improvements and fixes:
- Consumed carbon intensity coverage substantially improved, ~98% of EIA carbon intensity events now have consumed rate
- Historic
EEIcarbon intensity now available before 2/29/2020 when the BA was retired - Fixed a bug in the
/aggregateendpoint that caused postal code queries to fail
October 11, 2022
SOC 2
Adding to the significant security and reliability improvements we've made this year, we've now formally begun the process of SOC 2 certification. We'll now have automated continuous monitoring of our infrastructure from Drata as we work towards a full external audit.
Once certification is complete we'll make the full audit report available to anyone who wants it.
We're hiring!
If you know anyone who is passionate about decarbonization, has product management experience, and wants to learn more, check out the job description and please reach out!
Other improvements and fixes:
- OGE: Fixed an issue affecting consumed emission rates
- OGE: Fixed several issues affecting SO2 calculations
- OGE: Updated AZPS data to handle incorrect reporting
September 9, 2022
Open Grid Emissions Initiative
We are very proud to announce the initial release of Open Grid Emissions (OGE) - an open source dataset of hourly US grid generation, carbon intensity, and air pollution data. Get free access to the data, or read more in our announcement blog post or from Canary Media.
MISO Historical Emissions Map
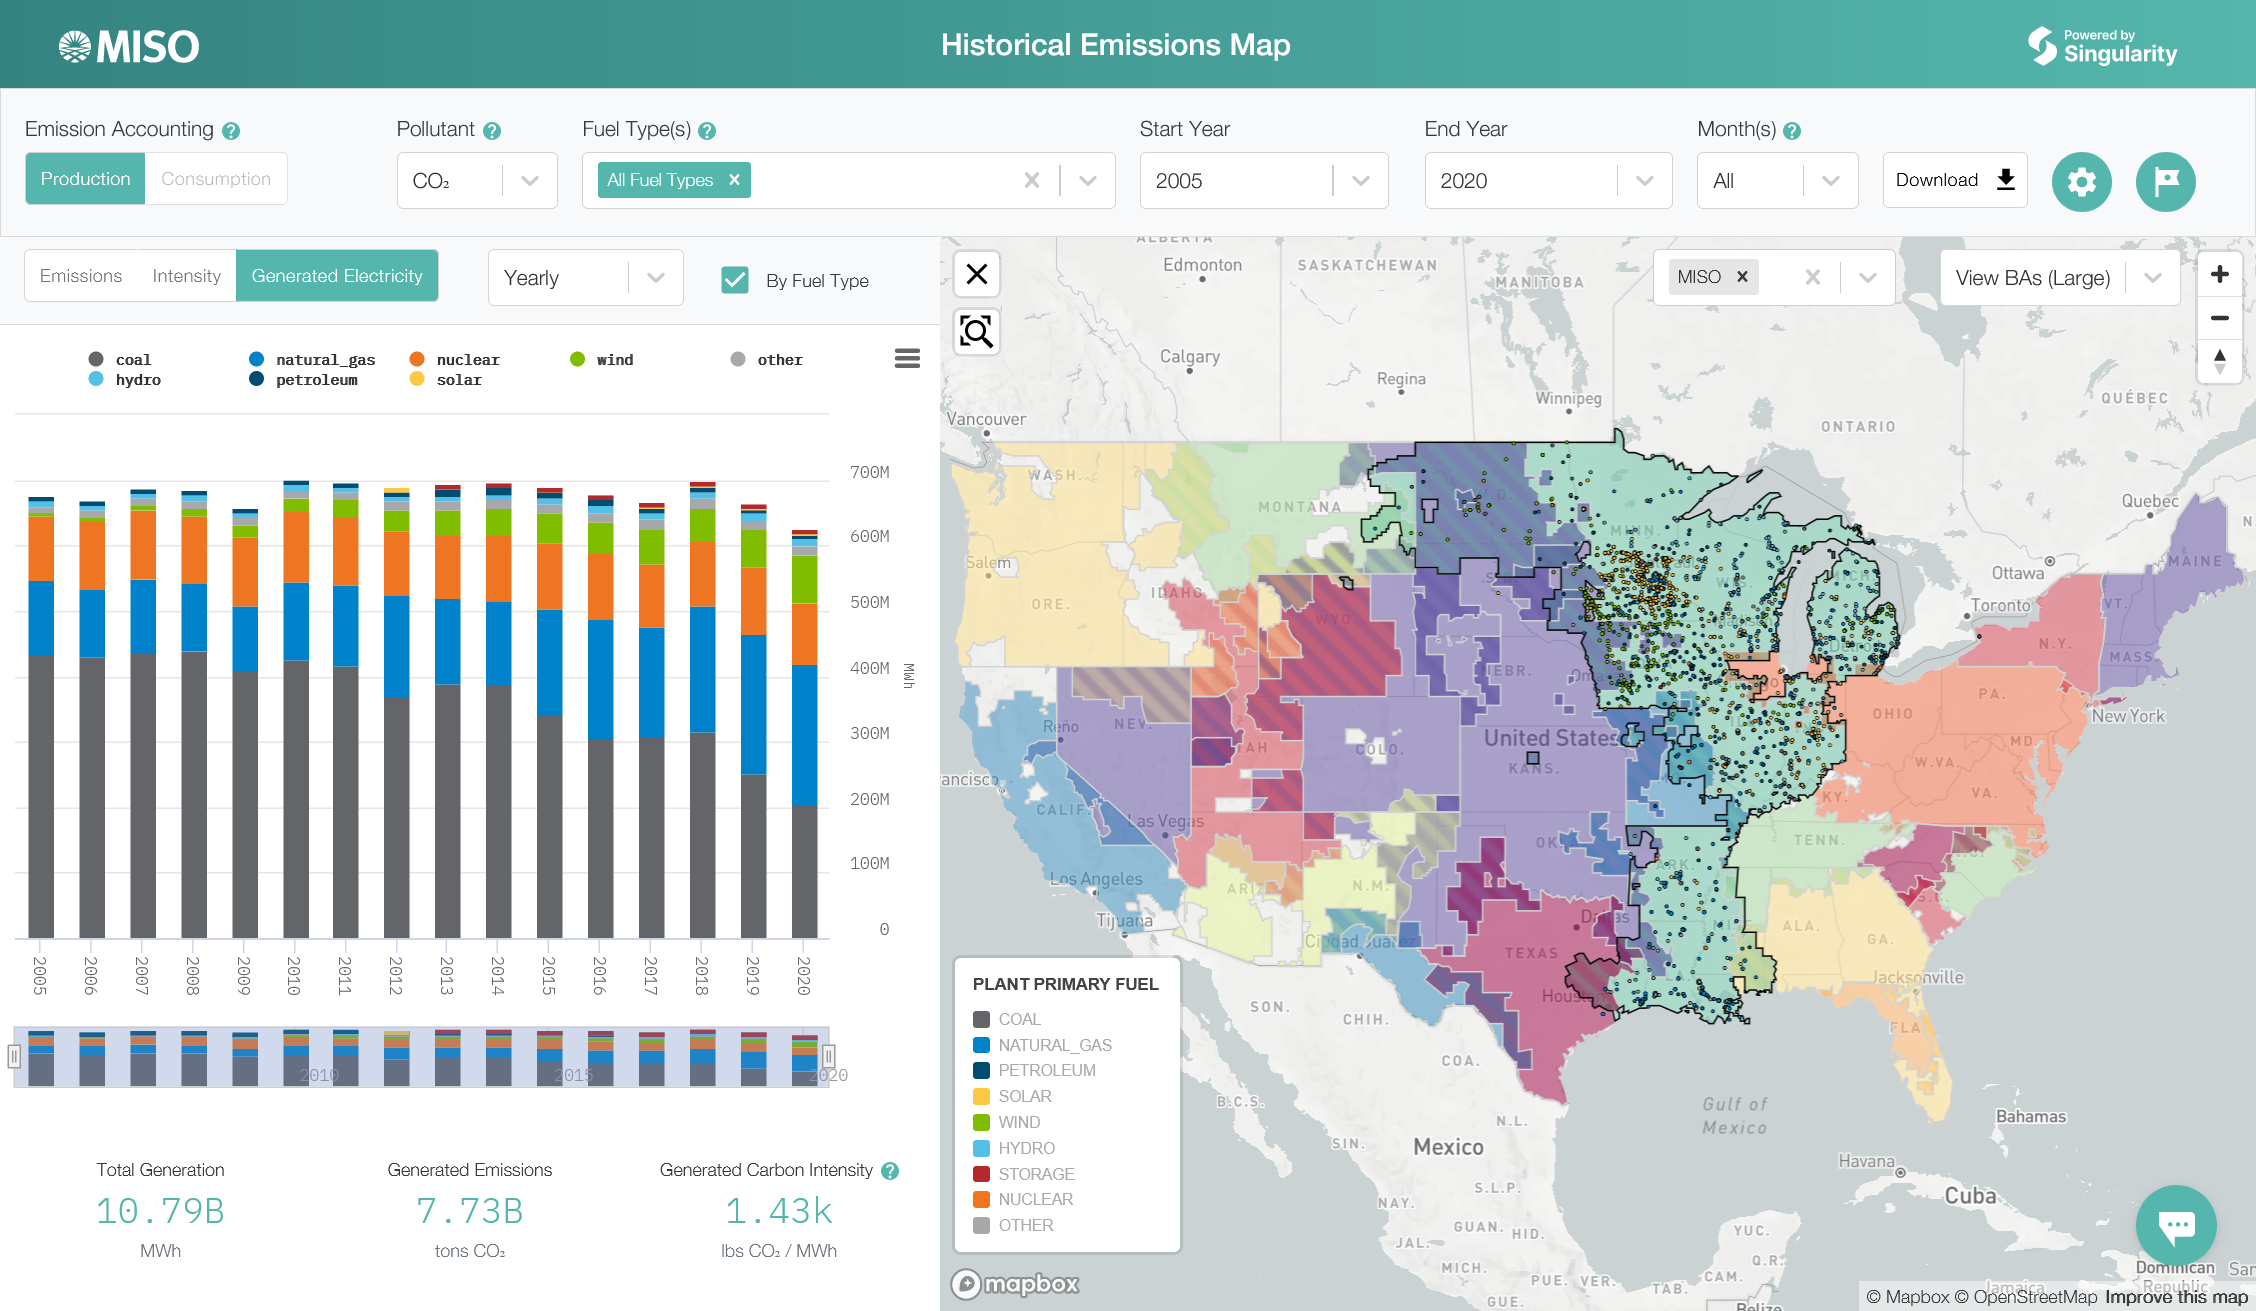
We're also announcing the public release of our MISO Historical Emissions Map, a collaboration with MISO that shows plant-level historical emissions data going back through 2005. This map builds off the OGE data, and you can select the Daily or Hourly option to explore OGE in an interactive visualization.
We've been working hard on both these projects for quite a while behind the scenes, and you can expect to see continued development and improvements in future changelogs.
Other improvements and fixes:
- Added solar to BPA fuel mix
August 11, 2022
Infrastructure Automation
We've spent a substantial amount of effort automating the maintenance and deployment of our entire infrastructure, upgrading most of it along the way for improved security and performance. What does this mean for you? If we've done things correctly, you shouldn't notice anything at all. It's more about what you won't see - no service outages, no performance issues, no security incidents. This effort also lays the groundwork for us to smoothly scale our API to an increasing number of users and an ever-growing amount of data.
The Return of EIA
They were down for more than a month, but happy to announce that EIA systems are finally back online and publishing every day. We've backfilled all data from the period EIA was down, so we once again have full uninterrupted coverage of the continental US.
This was an outage of unprecedented length, and we hopefully won't see anything like it for a long time. When there are issues of this magnitude, you can look for information and updates on our status page, and you may also receive direct communication from us depending on the severity of the issue.
June 16, 2022
Seed Funding
A few weeks ago we announced that we've raised $4.5M in seed funding led by Spero Ventures and Energy Impact Partners, as well as $1.2M in National Science Foundation SBIR grants. Today, grid operators, utilities, and businesses have a limited understanding of their grid carbon emissions due to the lack of high-quality, time and location-based grid emissions data. Our mission is to change that by providing transparent and accurate data to grid operators, utilities, and businesses about their grid carbon emissions, while supplying them with actionable decarbonization insights and automated decision making via their platform.
You can read more about the investment in our Medium post, and on TechCrunch.
Coming Soon
We've got a number of projects brewing behind the scenes that we're excited to announce later this year. Here's a sneak peak of one: our V2 API. We'll soon be inviting you to try out the next generation of our API, which is faster, more powerful, more auditable, and overall much easier to use.
Documentation
Just a reminder: our new docs are much, much better than the old ones. They go well beyond technical API details - in particular, you might want to check out our Key Concepts overview, which helps answer a lot of questions about how to get the most out of the API.
May 12, 2022
New Documentation
As promised in our last changelog, we've been hard at work on our new documentation center. Take a look: https://singularity-docs.stoplight.io/. In addition to interactive API endpoint documentation, we now have articles explaining our geographic coverage, emissions methodology, carbon event terminology, and more.
We think this is a big improvement over our current docs, and should help users get the most out of our API. If you have any feedback, suggestions, comments, feel free to email us at info@singularity.energy.
Security Improvements
Security is a continuous process, and we're always making improvements and monitoring our systems in the background. No news is good news here - hopefully you'll never have to think about our security practices! However, there's one new development to highlight: we've initiated a third party penetration test, to ensure our systems and controls are solid. This will be an annual exercise, and once the first test is complete we'll be happy to provide the resulting report upon request.
Apr 12, 2022
Compliance API
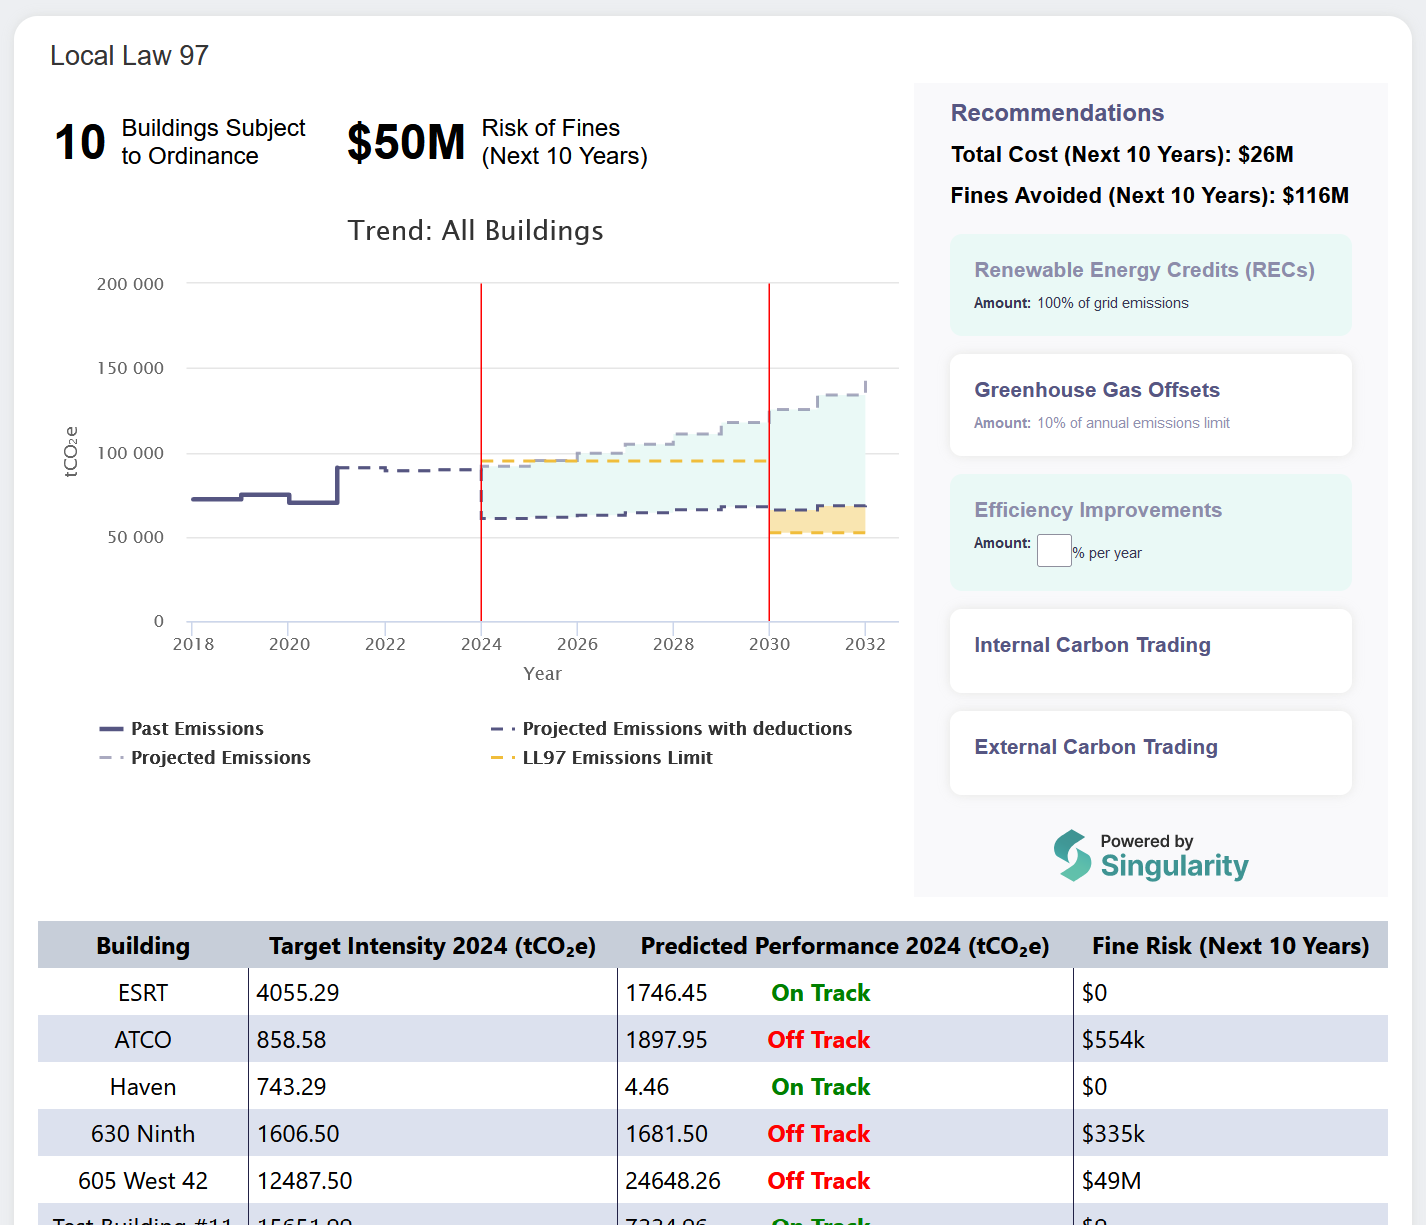
We've released a new Compliance API, along with the companion web app shown above, to allow building owners to explore how they're performing against applicable carbon regulations, and what their options are to reduce emissions. The initial release covers New York City's Local Law 97, and future releases will cover Boston's BERDO and beyond, as climate regulations (hopefully) sweep the nation in coming years.
If you're interested in trying out the API or embedding the compliance tool into your own web app, reach out!
New API Docs
No more Google Docs! We're testing a new documentation platform - check it out. This is still a work in progress, so you can expect more improvements and content before this goes live in the next few weeks. As always, if you have any feedback, we're all ears.
Mar 7, 2022
Expanding Singularity's Team
We’ve quadrupled the size of our engineering team, bringing on two new software engineers and a data scientist. With more engineering bandwidth, you can expect lots of upcoming improvements to API performance, data quality, and documentation.
One of the first priorities of our expanded team has been to build on the data quality improvements described in past changelogs (for some background, take a look at our October 2021 changelog). Each of the data sources we collect from has a different set of anomalies, time gaps, and other issues that need to be detected and fixed. To ensure consistent data quality,we customize issue detection and handling for each source. This month, we’ve added data issue handling for EIA, and expanded our quality checks for ISONE.
Improvements and fixes:
- We updated our handling of EIA data issues to reflect the detection and imputation of anomalous data performed during EIA’s own analysis. This means you have access to the same imputed data EIA uses to compile monthly and annual summaries – but we flag imputed values, so you know whether you’re seeing real or imputed data
- We now audit our database daily to detect missing and anomalous data from EIA and ISONE and re-collect it when possible
Jan 15, 2022
Imports and Exports
The simplest method of calculating grid carbon intensity is to look at the fuel mix reported by the grid operator - a breakdown of which types of power plants are producing electricity for the grid at a given time. This is generated_rate, the default for much of our API. But this methodology excludes an often important factor: imports and exports. In addition to its own generation, Grid A may be importing fuel from Grid B, which may itself be importing from Grids C and D, and so on. The picture quickly becomes complex. In order to calculate Grid A's carbon intensity, we'll need to look at the fuel mix and imports and exports of potentially many other grids.
The result of this calculation is consumed_rate, available for all EIA regions in our API. But this methodology is vulnerable to a wide array of data quality issues. Instead of relying on a single source, we need data from every grid operator in the grid interchange graph. There can also be conflicting data - what happens when New York and New England both claim to be exporting electricity to each other at the same time? Recently we've been working on cleaning up the data underlying our consumed_rate calculations, and filling in as many gaps as possible. It's an ongoing process, but if you're using this rate you'll see more consistent results as we're constantly improving the data pipeline.
We're Hiring!
If you know anyone who is passionate about decarbonization, has software or data science experience, and wants to learn more, check out the job descriptions below and please reach out!
***
Dec 6, 2021
Negative Generators
What happens when a power plant is reporting negative power? Thanks to a tip from an API user, we've been looking into this recently: what does it mean when a region says it produced -4 MW from natural gas?
Power plants consume electricity themselves, and occasionally, when they're still running but their output isn't needed for a time, they might burn more power than they generate. Even more occasionally, sometimes demand for a particular fuel type in a region is so low that all power plants of that type are sitting idle, and the total region-wide sum of power generated is negative.
So, what's the carbon intensity of negative power? This edge case raises some interesting philosophical questions (Am I responsible for emissions that didn't come from producing any power?), as well as practical ones: What's the intensity of an idling natural gas plant?. It isn't zero, and it certainly isn't negative - these plants aren't absorbing CO2 out of the air while they're sitting idle.
To be frank, we're still thinking about the best way to handle this, and as is so often the case in carbon accounting, there's more than one valid answer. For now, we're treating these negative values as zeros, with a corresponding carbon intensity of 0 lbs/MWh. The EPA eGRID intensity model already accounts for negative generation, so over a longer period of time, these brief periods of 0 emissions should be balanced out by slightly higher emissions when generation is positive. This approach is straightforward, but it's not ideal, and you can expect future changelogs to note updates as we continue to investigate.
Improvements and fixes:
- Fixed brief outage in EIA generation and interchange scrapers
- Correct misspelled fuel types from some historical sources
- Marginal carbon intensity calculation now better handles missing fuel mix events
Nov 2, 2021
Status Update

We have a new status page! It tracks the overall uptime of our services, and you can sign up for email or Slack alerts in case of an incident. For now, this page will exist in parallel with our regional metrics page, which tracks the health of specific event types. In the future we'll unify these pages, and enable you to receive alerts when a specific region has an issue.
New York Nuclear
What happens when a nuclear power plant shuts down? New York State recently retired two nuclear reactors, Indian Point Unit 2 and Unit 3, after 50+ years of operation, replacing them with newly constructed natural gas plants. Let's look at the data to see what happened. First, the NYISO fuel mix trend makes the ~2GW reduction in nuclear plainly visible:

Other fuel types stayed roughly constant, and are not shown in the above graph. Now, how did these changes affect NYISO's carbon intensity?

There's a small but visible increase in intensity across the period shown - not the trend New York is looking for given their goal of 70% renewable generation by 2030.
Oct 4, 2021
Continuously Improving Data Quality
We collect data from a lot of sources, and we've seen many different ways that data can be flawed. Maybe an ISO unexpectedly changes its reporting format, or reports all 0s for an interval, or stops updating at all for an hour or two, or any number of other problems. We've spent the last couple weeks improving our system of monitoring data quality to detect these issues, and just as importantly, correct them as soon as possible.
We're focused on five dimensions of quality:
- Completeness: Are there any gaps in the data? How large and how frequent are they?
- Timeliness: How quickly does data arrive in our system after it's published?
- Validity: Does the data make sense? Are there missing fuel types or anomalous values?
- Consistency: Do different sources for the same information agree? Do our forecasts match the real data?
- Integrity: Do we have the full chain of events, from (for example) raw fuel mix data all the way to a subregional carbon intensity?
When we do detect an issue, we'll record it, and automatically check back every once in a while to see if the source has updated data. Often, issues are fixed within the hour, or the next day.
In the future, you'll see more of these dimensions reflected on our status page. For now, next time you see a suspiciously high carbon intensity or a fuel mix that drops to zero, check back in a little while and see if it isn't fixed.
Improvements and fixes:
- Fixed occasional issue with SPP data just after midnight
- Added
updated_atmetadata to track when events were last modified
Sep 3, 2021
EIA.CISO and EIA.PJM data anomalies
Thanks to the help of an eagle-eyed API user, we've corrected two issues with EIA data. First, there is a 10-month period during which CAISO failed to report the "hydro" and "other" fuel types to the EIA:
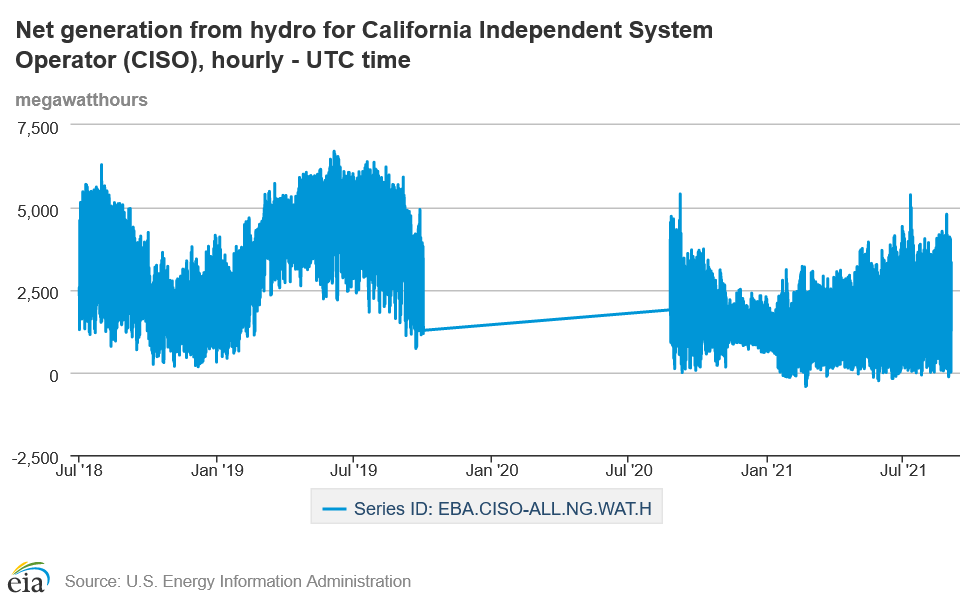
We've amended EIA.CISO data during this period with "hydro" and "other" values from direct CAISO data.
In addition, EIA.CISO and EIA.PJM data appears to be consistently one hour behind direct data from CAISO and PJM. We believe these two ISOs are reporting correct data through their own APIs and dashboards, but submitting to the EIA with the wrong timestamps, causing the mismatch. We've timeshifted EIA.CISO and EIA.PJM to correct the issue, and we'll continue working with the EIA to identify any other regions that may be affected by this.
Improvements and fixes:
- Forecast lookahead monitors on the status page now show the correct colors
- Removed imports from CAISO generated fuel mix for consistency with other ISOs
- Improved data quality of CAISO and SPP generated fuel mix